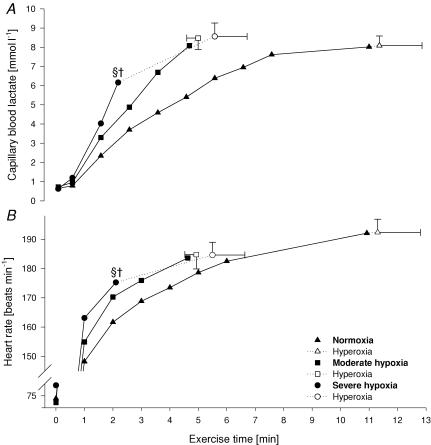
Figure 3. Capillary blood lactate (A) and heart rate (B) during various exercise trials.
Filled symbols represent values obtained in the respective FIO2 condition (0.21/0.15/0.10), open symbols indicate values at exhaustion in hyperoxia (FIO2 0.30). §P < 0.05 versus exhaustion in normoxia and moderate hypoxia. †P < 0.05 versus exhaustion in hyperoxia.

