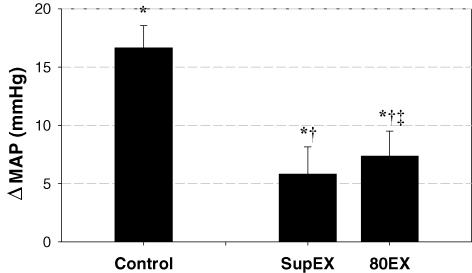
Figure 2. Summary data showing changes in mean arterial pressure (MAP) from upright rest during each exercise condition.
The change in MAP in both the supine (SupEX) and higher pedalling frequency (80EX) exercise conditions was significantly lower than control upright exercise at 60 r.p.m. Values are means ± s.e.m. *Different from upright rest, P < 0.05; †different from control exercise, P < 0.05; ‡different from SupEX, P < 0.05.

