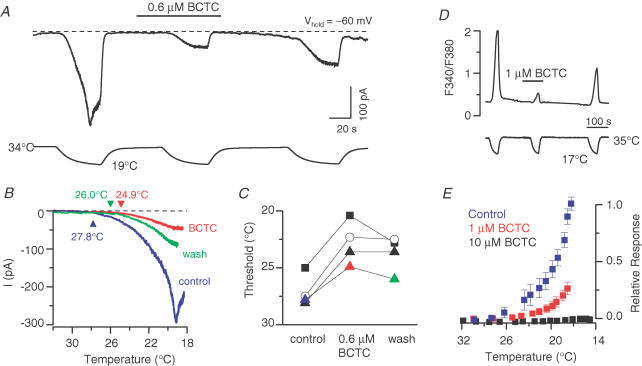
Figure 5. BCTC lowers the response-threshold temperature during cooling.
A, simultaneous recording of whole-cell membrane current (top trace) and bath temperature (bottom trace) during application of three consecutive cooling ramps to a TRPM8-transfected HEK293 cell (holding potential, −60 mV). Application of 0.6 μm BCTC produced a reversible reduction in Icold amplitude. The dashed line indicates the zero current level. B, close-up and superposition of the cold-evoked responses shown in A in the absence and presence of 0.6 μm BCTC. The current traces were corrected to yield a 0 pA baseline; holding potential, −60 mV. C, response-threshold temperatures of four cells during cold applications in control solution, 0.6 μm BCTC and after washing. The coloured symbols correspond to the cell in A and B. D, fluorescence ratiometric (F340/F380) calcium-imaging recording of cold-evoked responses in the absence and presence of 1 μm BCTC. E, relative response versus temperature curves constructed from cooling ramps in the presence of 1 and 10 μm BCTC. For each cell, the relative response at each temperature was calculated as the fluorescence response normalized to the expected maximum response of the cell, defined in eqn (1). The control curve was obtained in an identical manner from experiments where the second cooling application was also performed in the absence of drug. Each data point represents the average of 16–19 cells. For clarity, error bars are omitted where negligibly small.

