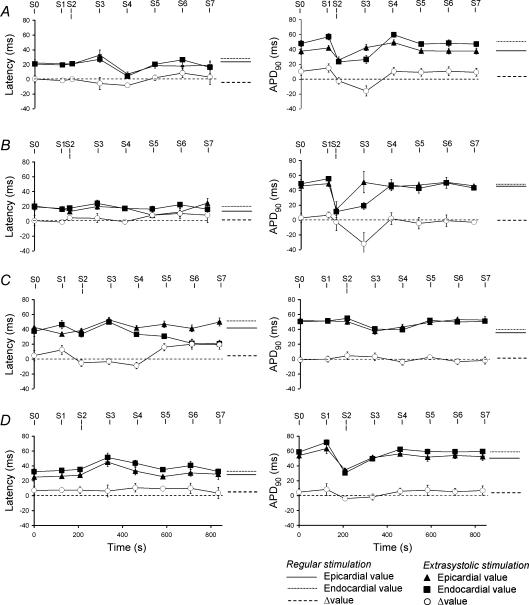
Figure 5. Transient alterations in ΔAPD90 following S2 stimulation close to refractoriness.
Effect of regular stimulation at a 125 ms interstimulus interval and of S2 stimulation at an S1S2 interval just greater than the ventricular effective refractory period on the difference between endocardial and epicardial latencies, Δ(latency) and on the difference between endocardial and epicardial action potential duration at 90% repolarization, ΔAPD90 after 15 min exposure to normokalaemic (A) and hypokalaemic (B) test solutions, and normokalaemic (C) and hypokalaemic (D) test solutions containing lidocaine. Epicardial ΔAPD90 on regular stimulation (continuous lines) and on S2 stimulation (triangles), endocardial APD90 on regular stimulation (dotted lines) and on S2 stimulation (squares), and ΔAPD90 on regular stimulation (dashed lines) and on S2 stimulation (circles). Lines indicate the timing of stimuli.

