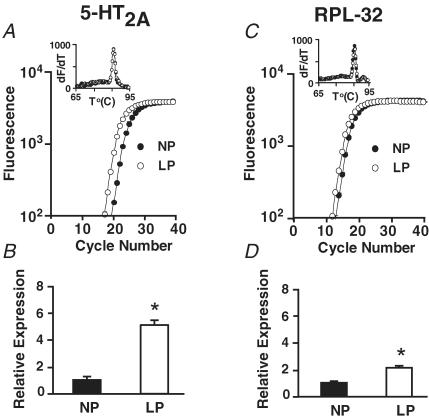
Figure 2. 5-HT2A receptor transcript levels are up-regulated at the end of pregnancy.
A, plot of real-time PCR fluorescence intensity versus cycle number for 5-HT2A in NP (•) and LP (○). The threshold cycle number was lower in LP rats as compared to NP, demonstrating up-regulation of 5-HT2A transcripts. B, bar graph showing mean relative expression of 5-HT2A receptor transcripts normalized to NP. Mean values were 1 ± 0.21 for NP and 5 ± 0.29 for LP. C, plot of real-time PCR fluorescence intensity versus cycle number for RPL-32 (ribosomal protein) in NP (•) and LP (○). Bar graph showing mean relative expression of RPL-32 normalized to NP. Mean values were 1 ± 0.08 for NP and 1.9 ± 0.04 for LP (n = 3).

