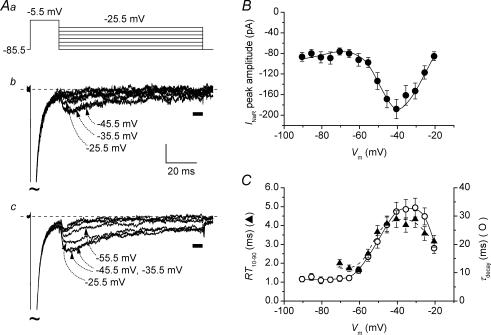
Figure 1. Resurgent Na+ current (INaR) in layer II pyramidal neurones of PRC area 35.
A, INaR in two representative pyramidal neurones (cell C6607 in Ab, cell B6607 in Ac). The experimental tracings are the currents recorded in response to the depolarizing–repolarizing voltage command shown in Aa. Voltage values specified in Aa are corrected for junction potential. In Ab and Ac, the voltage level of the repolarizing pulse is specified for some tracings. The horizontal bars indicate the tracing region over which data points were averaged to obtain an estimate of the persistent Na+ current (INaP) amplitude. y-axis calibration bar: 150 pA (Ab), 225 pA (Ac). B, current–voltage dependence of INaR, measured by subtracting INaP amplitude from raw INaR peak amplitude. Data points are average values from 14 cells. C, average voltage dependence of INaR rise time 10–90% (RT10–90: ▴) and INaR decay time constant (τdecay: ^). τdecay was obtained from mono- or biexponential fitting of INaR decay phase. When decay was biexponential, the faster exponential component, which was the prevalent one, was considered. Data points are average values from 14 cells.

