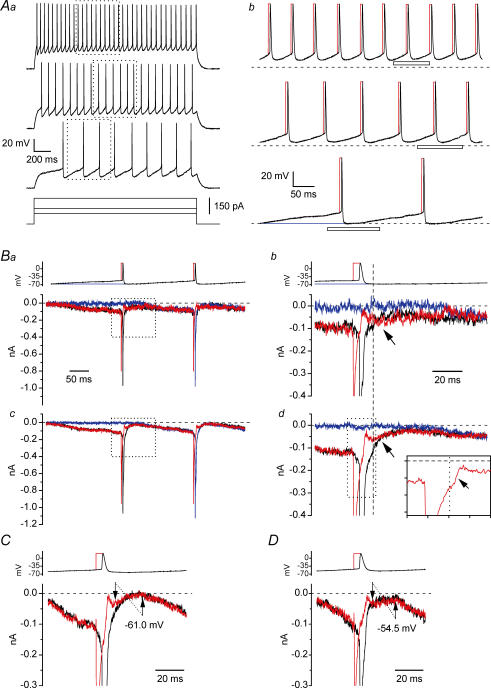
Figure 2. INaR recruitment during repetitive firing.
Aa, repetitive action potential (AP) discharge evoked, under current-clamp conditions, in a representative regular spiking neurone (cell 06721) in response to three depolarizing current steps of increasing amplitude (bottom panel). Firing frequencies were ∼5, 13 and 20 Hz. The tracing regions embraced by the dotted-line boxes were used to construct waveform commands for voltage-clamp recordings. Ab, voltage-clamp waveform commands derived from the 5 Hz (bottom), 13 Hz (middle) and 20 Hz (top) tonic discharges shown in Aa. Black lines are protocols consisting of the original, unmodified voltage trajectories. Red lines are protocols in which the repolarizing phase of each AP was preceded by a 5 ms square pulse at the AP peak level. The blue line is a modified protocol in which the initial ramp depolarization and the first AP and afterhyperpolarization were replaced by a fixed, basal voltage level (Vbas) of −67.0 mV. The horizontal, dashed lines indicate the −67.0 mV voltage level. B, currents recorded in response to the 5 Hz discharge protocol (top). Ba and Bc show the currents recorded in a single representative neurone (cell B6026), and average currents from 6 neurones, respectively. Bb and Bd are a detail, over expanded time and amplitude scales, of the tracings shown in Ba and Bc, respectively. The portions of voltage protocols and current tracings highlighted in Bb and Bd are indicated by the dotted-line boxes in Ba and Bc, and by the horizontal bar in Ab, bottom. Each current tracing corresponds to the voltage command identified by the same colour. The arrows point to the early interspike inward Na+ current (black line), which largely superimposes to the INaR component elicited by the hybrid protocol (red line). The vertical, dashed line indicates the time point at which the repolarization phase of the original AP waveform crossed the −67.0 mV voltage level. The inset in Bd shows a further detail of the current evoked by the hybrid protocol. The current portion illustrated corresponds to that contained in the dotted-line box in the main panel. Each x- and y-axis subdivision is 5 ms and 100 pA, respectively. The horizontal dashed line in the inset is 0 pA, the vertical dotted line indicates the time point corresponding to the maximal slope of the command waveform repolarizing phase. C and D, detail of the currents recorded in response to the 13 Hz and 20 Hz protocols. The tracing segments illustrated here correspond to the portions of command voltage waveforms indicated by the horizontal bars in Ab (middle and top). Each tracing is the average of the currents recorded in 6 neurones. The two arrows of each panel indicate two time points corresponding to the same voltage level in the command waveform (−61.0 mV in C, −54.5 mV in D), the first one preceding and the second one following the peak post-spike hyperpolarization.

