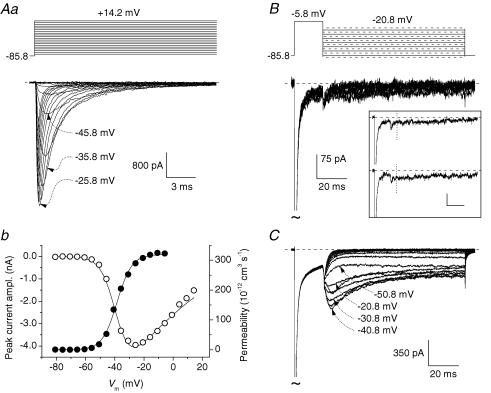
Figure 3. INaR is absent in acutely dissociated area 35 layer II neurones.
A, INaT in a representative acutely dissociated neurone (cell A5624). Aa shows current tracings recorded in response to an INaT activation protocol (top of the panel). Specified voltage values are corrected for junction potential. Ab illustrates the current–voltage relationship of INaT (^) and voltage dependence of the underlying permeability (•) for the same cell. Permeability values were calculated from peak-current values as explained in Methods. The smooth line interpolating permeability data points is the best Boltzmann fitting (V1/2 and k are −38.5 mV and −5.0 mV, respectively). The smooth line interpolating current data points has been obtained from the same Boltzmann fitting by converting permeability into current on the basis of the Goldmann–Hodgkin–Katz equation (see Methods). B, the currents recorded in the same neurone in response to an INaR activation protocol (top of the panel). For clarity, only currents corresponding to repolarization levels of −25.8 to −85.8 mV in −10 mV increments are shown in the main panel. The inset shows a detail of the currents recorded at the repolarization levels of −35.8 mV (top) and −40.8 mV (bottom) (calibration bars in inset: 20 ms, 75 pA). The vertical, dotted lines mark the time points at which INaR peak would be expected, based on data from intact neurones. Note the lack of INaR. C, the currents recorded in a representative acutely dissociated Purkinje neurone (cell D5304) in response to the INaR activation protocol. Note the prominent INaR component.

