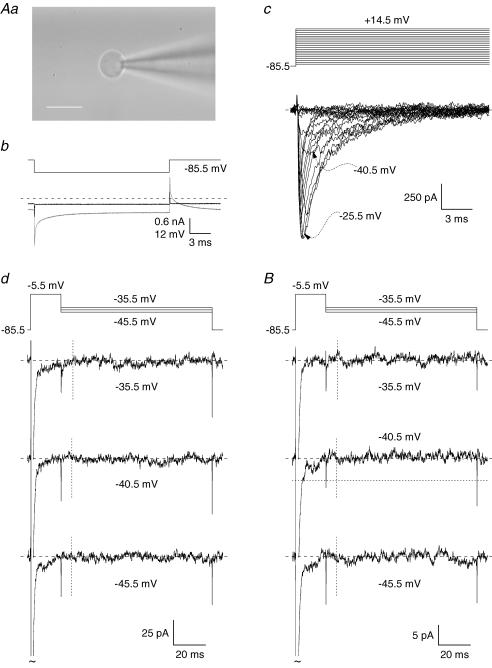
Figure 4. Lack of INaR in nucleated patches from area 35 layer II neurones.
Aa–d illustrates an experiment carried out in a representative nucleated patch; B shows average data from 12 nucleated patches. Aa, microphotograph of the nucleated patch from which the data shown in Aa–d were obtained (patch no. G7307) (calibration bar: 10 μm). Ab, the currents recorded in response to a 20 ms, −10 mV hyperpolarizing voltage square pulse (top) in the whole-cell condition before nucleated-patch isolation (grey trace), and in the nucleated patch (black trace). Note the marked reduction of both capacitive transients and steady-state currents after nucleated-patch isolation. Ac, the currents recorded in the same patch in response to the INaT activation protocol (top). Ad, the currents recorded in response to the INaR activation protocol (top; only the currents corresponding at the repolarization levels of −35.5, −40.5 and −45.5 mV are shown here). B, average traces obtained from the currents recorded in 12 nucleated patches in response to the INaR activation protocol (top). The vertical, dotted lines in Ad and B correspond to the time points at which INaR peak would be expected, based on data from intact neurones, at each repolarization level. The horizontal, dotted line in B marks the current level corresponding to the expected INaR peak, as determined under the assumption that INaR is equally expressed in somatic membranes as in intact whole cells (see Results for details).

