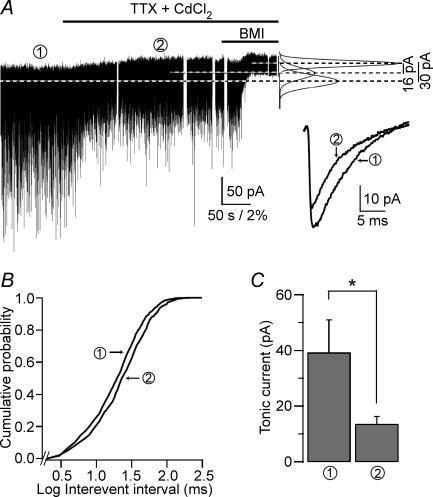
Figure 1. Concomitant reduction in phasic and tonic inhibitions after blocking action potential-dependent vesicular release.
A, whole-cell voltage-clamp recording from a CA1 PC (Vh=−70 mV) in the presence of 3 mm kynurenic acid and 7.5 μm NO-711. Horizontal lines over the recording denote the time of drug perfusions. Right panel: Gaussian fits to all-points histograms derived from the numbered 30 s recording periods (1, control; 2, 0.5 μm TTX + 50 μm CdCl2) and a 15 s recording period during the perfusion of BMI used to determine the tonic current. The differences between the Gaussian means marked by the dotted lines are indicated. Inset: average sIPSC from the numbered time periods of the recording (1, 1130 events; 2, 919 events). B, cumulative probability of the log scaled interevent intervals recorded during the two numbered time periods (same number of events as used in the inset of A). C, the average tonic current is significantly reduced by blocking action potentials and Ca2+ entry into the terminals (39.1 ± 11.8 pA versus 13.5 ± 2.8 pA, n = 6 cells). *P = 0.031 Wilcoxon matched-pairs signed-ranks test).

