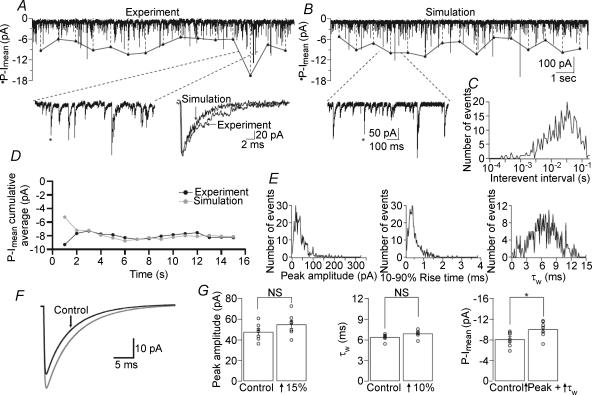
Figure 5. Comparison of experimental and simulated events.
A, whole-cell voltage-clamp recording from a CA1 PC (Vh=−70 mV). Left inset: higher magnification of a 1 s segment denoted by dashed lines. Right inset: single sIPSC (indicated by asterisks) overlaid from an actual experiment and from a simulation using the parameters obtained from the actual recording. B, a simulated 15 s trace using the parameters obtained from the recording in A. Inset: higher magnification of a 1 s segment marked by dashed lines. C, distribution of interevent intervals (corresponding to the frequency of 27.2 Hz of the events in A) used to generate the trace in B. D, plot of phasic Imean (P-Imean) cumulative average (calculated every second) showing no difference between experiment and simulation. E, peak, 10–90% rise time and τw distributions used to generate the trace in B, which were obtained by using in the simulation the mean and standard deviations of the respective parameters from the recording in A. F, average simulated sIPSC showing the difference when the peak and τw are both increased by 15% and 10%, respectively (grey line). G, when peak amplitude and τw are compared between two sets of simulations, they do not show statistical differences (peak: P = 0.174, n = 7; τw: P = 0.064, n = 7, unpaired t tests). The combined effect of the simultaneous, albeit non-significant, changes in the two parameters results in a significantly different phasic Imean(from −8.08 ± 0.53 to −10.0 ± 0.60 pA, n = 7, P = 0.031, unpaired t test).

