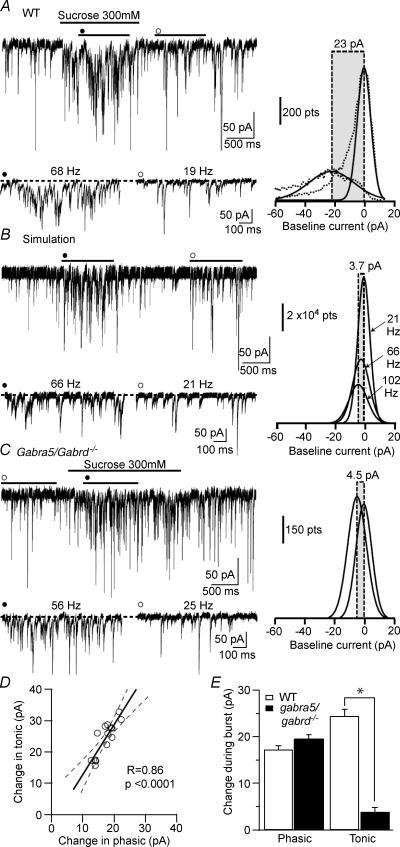
Figure 7. Tonic inhibition increases during induced sIPSCs bursts.
A, left panel: whole-cell voltage-clamp recording from a CA1 PC in the presence of 3 mm kynurenic acid and 5 μm GABA (Vh=−70 mV) where sucrose (300 mm, black line) was applied by low pressure from a pipette positioned close to the soma to induce a burst of IPSCs (•). Lower panel shows expanded 5 s segments from the burst (•, 68 Hz) and control (○, 19 Hz) conditions. The dotted line indicates the baseline current in the control condition. Right panel: Gaussian fits to the all-points histograms (dashed lines) of the two traces on the left indicating the shift in baseline current produced by application of sucrose (s.d. of the Gaussian fits: control 4.54 pA; burst 15.1 pA). B, left panel: simulated traces using the experimentally recorded sIPSC parameters. The dotted line indicates a baseline current of 0 pA. Right panel: Gaussian fits to all-points histograms of the simulated traces using the parameters obtained from the experimental condition at 1-times and 1.5-times the maximum experimentally obtained event frequency during the burst. The shifts in baseline current at the indicated frequencies are as follows: 21 Hz (−1.06 pA), 66 Hz (−2.93 pA) and at 102 Hz (−4.77 pA). GABA spillover should account for 20.1 pA of the increases in tonic current (23 pA – 2.93 pA). C, same as A but recorded from a Gabra5/Gabrd−/− double knockout mouse CA1 PC (Vh=−70 mV) that lacks tonic inhibition altogether. Note the absence of a tonic inhibitory current during the induced sIPSC burst (s.d. of the Gaussian fits: control 5.26 pA; burst 6.14 pA). D, linear regression between the burst-induced change in tonic and phasic currents indicating a high degree of correlation during a condition of increased vesicular GABA release (n = 14). Line represents the linear fit while dashed lines represent 95% confidence intervals. E, histogram plots of phasic and tonic current measured during induced bursts in wild type (WT) and in Gabra5/Gabrd−/− double knockout mice that lack tonic currents. (n = 14; *P < 0.001, unpaired t test).

