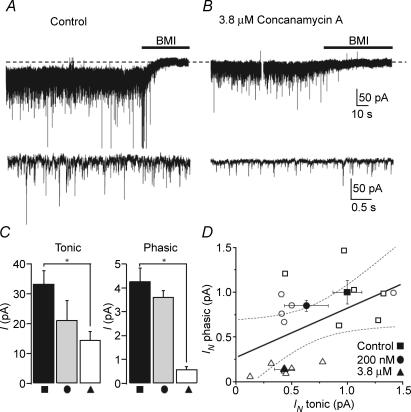
Figure 9. Correlated decrease in tonic and phasic inhibitions following a reduction in vesicular GABA content.
A, whole-cell voltage-clamp recording from a CA1 PC in the presence of 3 mm kynurenic acid and 5 μm GABA (Vh=−70 mV) showing a 44.3 pA tonic current. Lower panel: 5 s expanded segment of the trace shown above (phasic Imean=−4.21 pA) B, same as A but in a CA1 PC recorded in a slice pre-incubated in 3.8 μm concanamycin A for 1 h. The tonic current is 14.55 pA. Lower panel: 5 s expanded segment of the trace shown above (phasic Imean=−0.50 pA). C, bar graphs of tonic (left) and phasic (right) currents recorded under three different conditions: control (▪), 100 nm (•) and 3.8 μm concanamycin A (▴). *P < 0.05 (one-way ANOVA, Dunnett's post hoc test). D, linear regression between the normalized phasic and tonic currents. Symbols correspond to the experimental conditions in C; open symbols are individual experiments, filled symbols are mean ±s.e.m. Continuous line represents the linear fit to the data points while the dashed lines represent the 95% confidence intervals (r = 0.493, P = 0.044).

