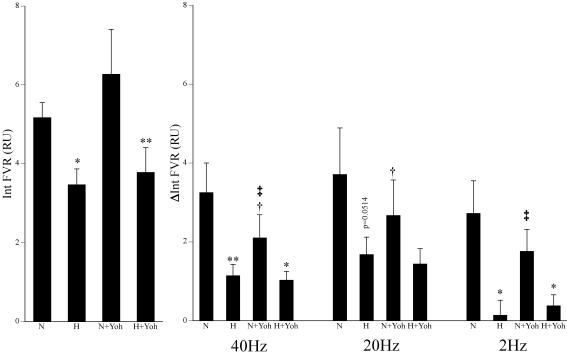
Figure 1. Effects of hypoxia and yohimbine on vasoconstrictor responses evoked in the hindlimb by different patterns of sympathetic stimulation.
Left panel shows baseline values of integrated femoral vascular resistance (FVR) over 1 min recorded immediately prior to sympathetic stimulation. Right panels indicate the responses evoked by the 3 patterns of sympathetic stimulation and show the mean ±s.e.m. of the change in integrated FVR (ΔInt FVR). Labels below columns indicate normoxia (N), hypoxia (H) and yohimbine (Yoh). Symbols indicate statistical significance of P < 0.05 (one symbol) and P < 0.01 (two symbols) where *=versus normoxia before or after yohimbine; †=versus before yohimbine in normoxia or hypoxia; and ‡=versus hypoxia before yohimbine.

