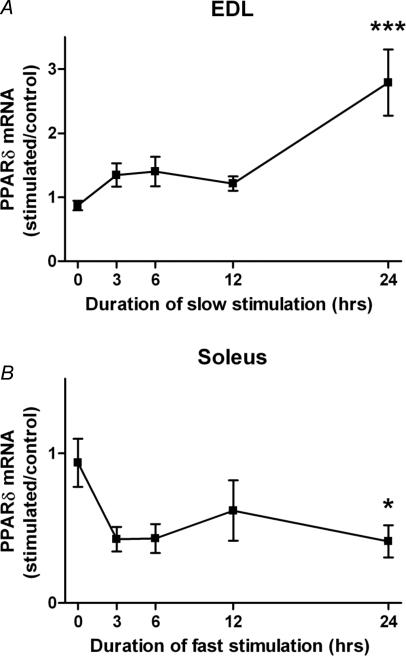
Figure 2. PPARδ mRNA levels change in response to different patterns of electrical activity.
A, a slow pattern of electrical stimulation increases the mRNA level of PPARδ in the EDL relative to the contralateral non-stimulated leg, and B, a fast pattern had the opposite effect on the soleus. For animals where the soleus was studied, the sciatic nerve was cut at the onset of stimulation in order to avoid the large amounts of activity from the CNS delivered to this muscle (Hennig & Lømo, 1985). Each data point represents the mean ±s.e.m. of six observations. *P < 0.05; ***P < 0.001; statistically different from normal muscles.

