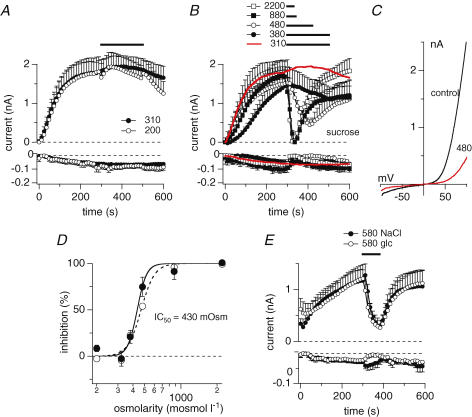
Figure 1. Hyper-osmotic conditions inhibit TRPM7.
A, average current development of murine TRPM7 inward and outward currents measured in overexpressing HEK293 cells. Cells were superfused with either isotonic bath solution (•, n = 5) or hypo-osmotic bath solution (200 mosmol l−1, n = 8) as indicated by the black bar. Hypo-osmotic conditions were achieved by reducing NaCl to 70 mm. Currents were elicited by a voltage ramp from −100 mV to +100 mV over 50 ms at 0.5 Hz intervals. Holding potential was 0 mV throughout. Inward current amplitudes were extracted at −80 mV and outward currents at +80 mV, averaged and plotted versus time with error bars representing s.e.m. Cells were perfused with the standard intracellular caesium-based solution in the absence of Mg·ATP, with 0.9 mm free Mg2+ and 10 mm Cs-BAPTA. Error bars indicate s.e.m.B, average time-course of TRPM7 inward and outward currents where cells were superfused with increasing concentrations of hyperosmotic solutions as indicated by the black bars (red trace isotonic (same trace as in D, n = 9); •, 380 mosmol l−1, n = 8; ^, 480 mosmol l−1, n = 5; ▪, 880 mosmol l−1, n = 3; □, 2200 mosmol l−1, n = 4). Data were analysed as in A. Hyperosmotic conditions were established by using sucrose. C, current–voltage (I–V) relationship taken from example cells just before application of 480 mosmol l−1 (black trace) and at the end of application (red trace). D, dose–response curve of current inhibition caused by application of increasing hyperosmotic extracellular solutions. Closed circles represent current increase at +80 mV, open circles at −80 mV (n = 3–9). Currents were measured before application (300 s) and at the end of application (330 – 500 s) and normalized to 300 s as I/I300s. Lines indicate a dose–response curve to the data with an IC50 of 430 mosmol l−1 and Hill coefficient of 8 (−80 mV) and 11 (+80 mV). E, average time-course development of TRPM7 inward and outward currents overexpressed in HEK293 cells and superfused with a hypertonic extracellular solution (580 mosmol l−1) as indicated by the black bar. Hyperosmolarity was achieved by adding appropriate amounts of either NaCl (•, n = 5) or glucose (^, n = 5). Currents were analysed as in A. Error bars indicate s.e.m.

