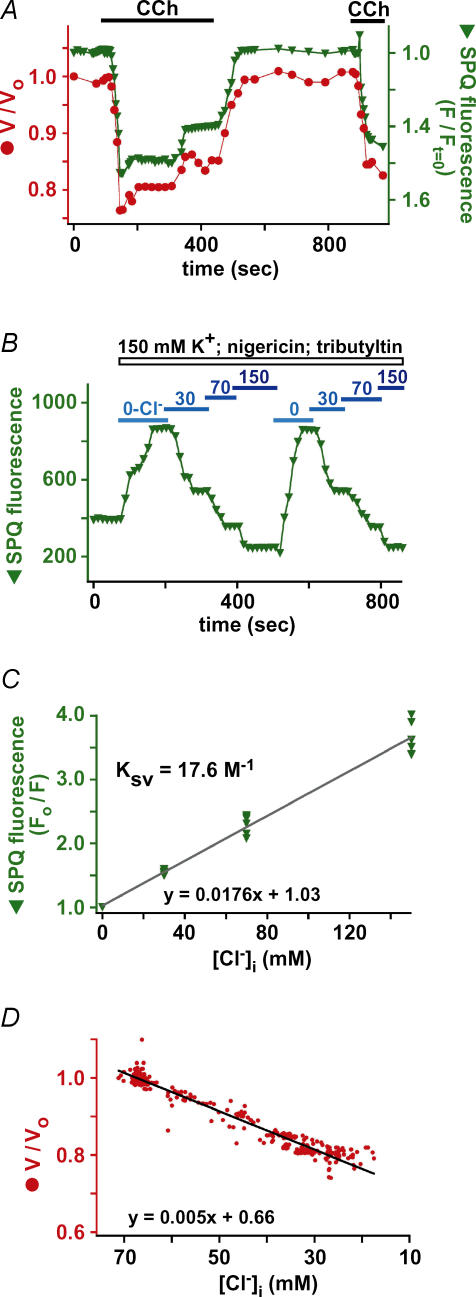
Figure 8. Changes in [Cl−]i parallel observed cell volume changes.
A, simultaneous determination of cell volume and SPQ fluorescence intensity (normalized to the intensity at t = 0 (F/Ft = 0) and plotted inversely) changes in response to 100 μm CCh. B, representative SPQ calibration experiment in acinar cells. C, composite Stern–Volmer plot of 6 calibration experiments. All values are represented as fluorescence in 0-Cl−/fluorescence (F0/F). Average F0/F-values were 1.55 ± 0.02 for 30 mm Cl−, 2.29 ± 0.06 for 70 mm Cl−, and 3.64 ± 0.1 for 150 mm Cl−. F0/F was 2.16 ± 0.06 under resting conditions before calibration, indicating resting [Cl−]i= 64.5 ± 4 mm. The quenching constant, KSV, determined from the slope of the least squares regression fit, was 17.6 m−1 (standard deviation (s.d.) = 0.5 m−1). D, composite plot of simultaneous [Cl−]i and cell volume determinations from 9 experiments during CCh stimulation that demonstrates tight correlation between the two parameters. Data were fitted with least squares linear regression, with slope equal to 5.56 m−1 (s.d. of slope = 0.210−3m−1).

