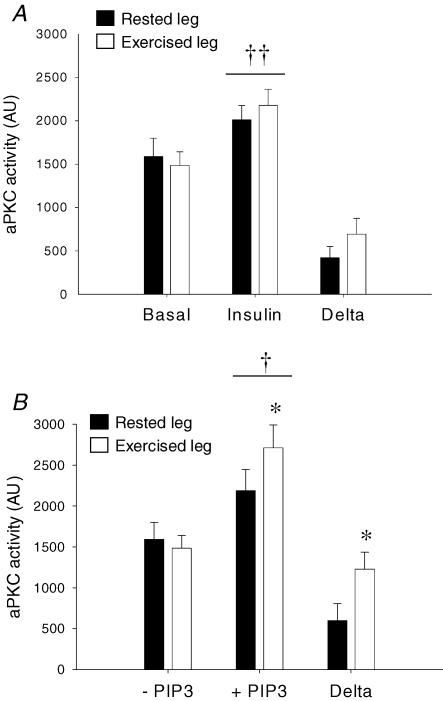
Figure 7. aPKC activity measured in vitro.
A, aPKC activity in basal and insulin-stimulated samples. B, aPKC activity in basal samples, with or without addition of 10 μm PIP3. Filled bars are values in the rested leg. Open bars are values in the previously exercised leg. ††P < 0.005 versus basal values. †P < 0.05 versus basal values. *P < 0.05 versus response to PIP3 in the rested leg. Values are means ±s.e.m., N = 12.

