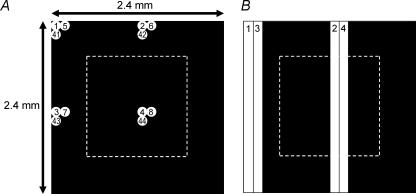
Figure 1. Stimuli used for mapping ipRGC receptive fields.
A, stimulus configuration for mapping the extrinsic light response. A single circular white spot (120 μm diameter) was presented sequentially at 400 different locations within a square retinal region measuring 2.4 mm on each side. The MEA was positioned at the centre of this region (dotted outline). The 2.4 mm × 2.4 mm square was divided into quadrants, each further divided into 10 columns and 10 rows. In each cycle of stimulus presentation, the white spot was presented sequentially at the same relative location (i.e. same column and same row) within each quadrant. In the subsequent cycles, the spot was shifted to the adjacent column in the same row until it reached the right-hand boundary of that quadrant (10th column), then ‘wrapped around’ to the first column in the next row. In the diagram, the 1st, 2nd and 11th cycles of stimulus presentation are illustrated. The spots are shown to scale, with numbers indicating the serial order of spot presentation at that location. B, the stimulus for mapping the intrinsic light response. The same 2.4 mm × 2.4 mm square was divided into two halves, with each half subdivided into 10 columns. In each cycle of stimulus presentation, a 120 μm × 2400 μm white bar was illuminated sequentially at the same relative position in each half of the square. In the following cycle, the bar was shifted to the next column. The diagram illustrates the first two cycles of stimulation.

