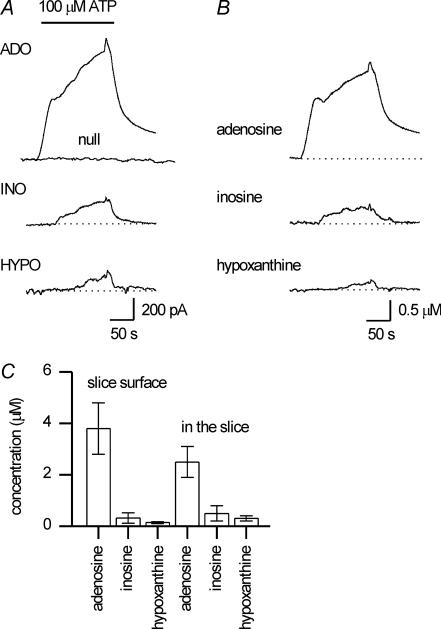
Figure 3. Exogenous ATP is metabolised by cerebellar slices.
A, example traces from adenosine (ADO), null, inosine (INO) and hypoxanthine (HYPO) biosensors placed on the surface of a cerebellar slice. Following application of 100 μm ATP, currents were produced on all the sensors except the null. B, the traces from A, calibrated and subtracted illustrating the metabolism of ATP to adenosine, inosine, and hypoxanthine. C, graph plots the mean concentration of ATP metabolites measured at the surface of slices (n= 6) and within slices (n= 7) following application of 100 μm ATP.

