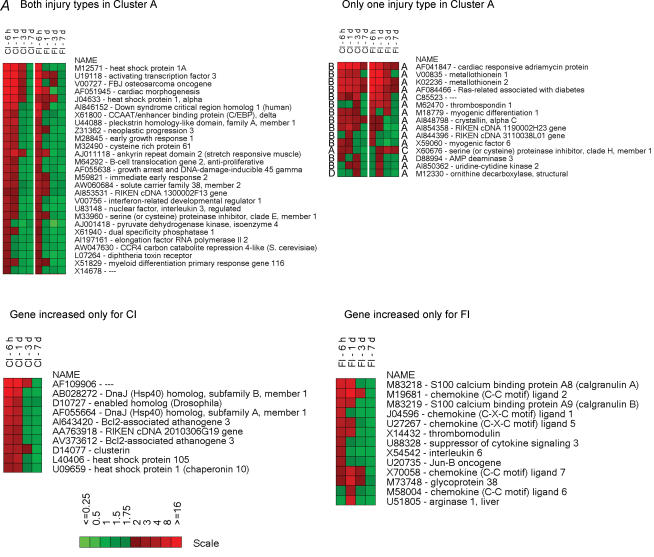
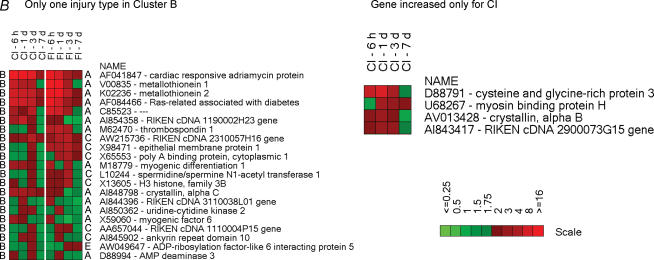
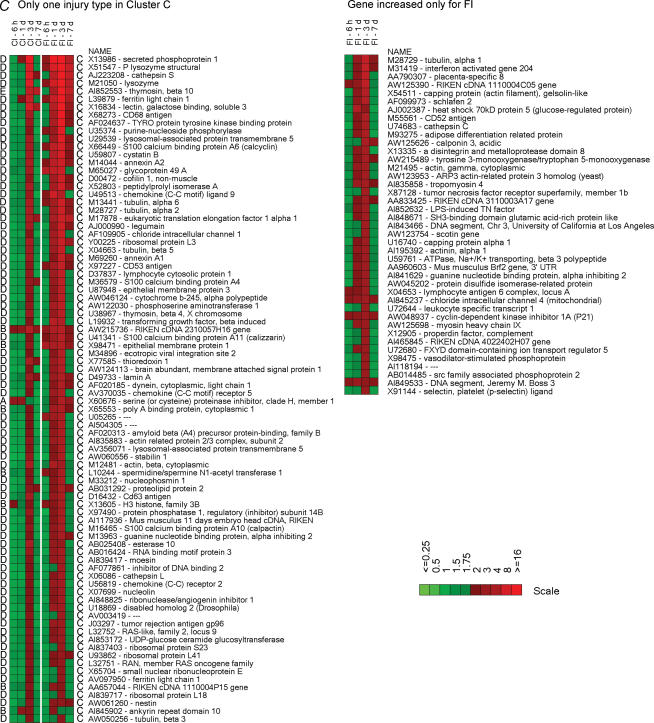
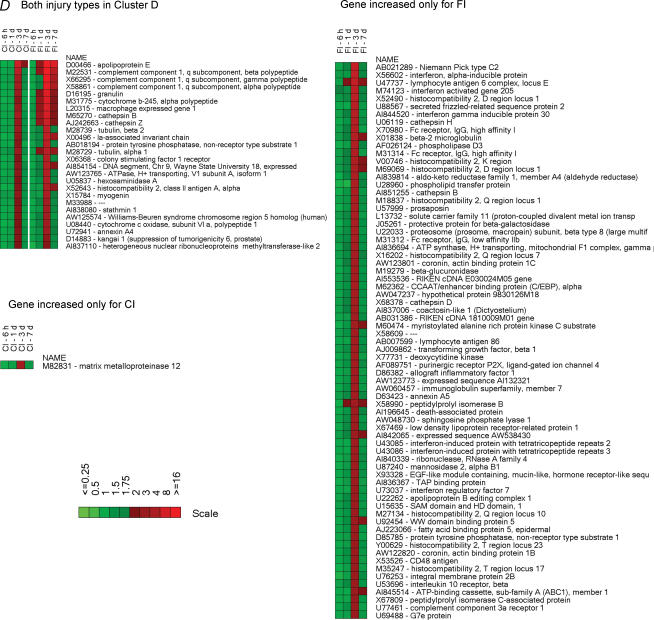
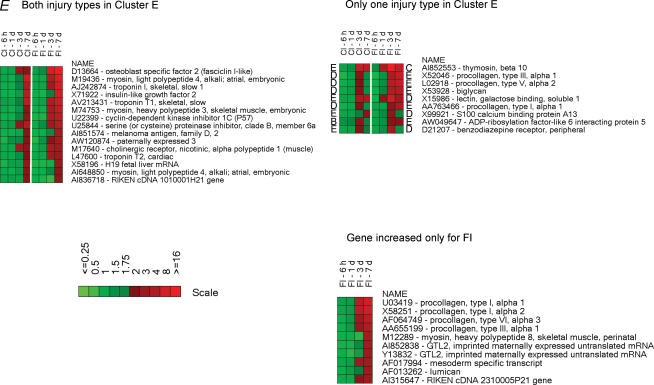
Figure 5. Heatmaps illustrating the temporal expression of individual genes in the six clusters.
Higher levels of expression are indicated by progressively brighter shades of red and reduced expression levels by increasingly brighter shades of green. The scale bars indicate the fold-change of gene expression (ratio of injured/uninjured TA muscle). Gene accession numbers and names are shown to the right of the maps. The heat maps for a given cluster are organized as follows: (1) differentially expressed (≥ 2-fold) genes in the same cluster for both types of injury, (2) differentially expressed (≥ 2-fold) genes in a given cluster for one type of injury but found in another cluster for the other type of injury and (3) genes that are differentially expressed (≥ 3-fold) by only one type of injury. The uppercase letters to the left and right of the heatmaps indicate the cluster to which the gene belongs; the left-hand and right-hand letters are for CI and FI, respectively.

