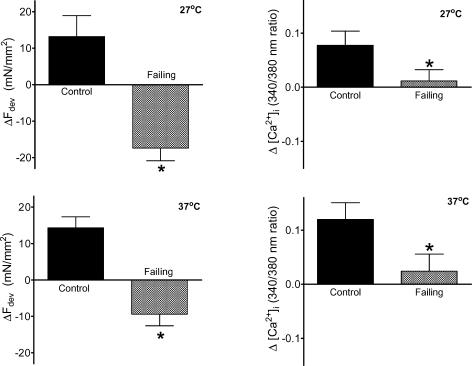
Figure 3. Changes in developed force (left panels) and changes in the amplitude of the [Ca2+]i transient (right panels) with an increase in stimulation frequency from 0.5 to 3 Hz at 27°C (upper panels) and from 0.5 to 6 Hz at 37°C (lower panels) from control (n= 10) and failing (n= 10) right ventricular trabeculae.
In the control group as well as in the failing muscles, the frequency-dependent increase in developed force was accompanied by an increase in amplitude of [Ca2+]i, although the amplitude of [Ca2+]i was decreased in the failing muscles compared with controls. Values are expressed as means ±s.e.m.*P < 0.05 versus control group.

