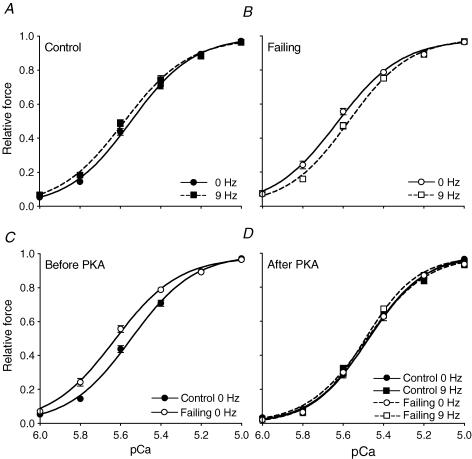
Figure 6. Isometric force–pCa relations in isolated skinned cardiomyocytes from control (A) and failing (B) quiescent (0 Hz) or stimulated (9 Hz) right ventricles before (C) and after (D) PKA treatment.
In the failing cardiomyocytes the force–pCa curve shifted to the right with an increase in frequency. At 0 Hz, the force–pCa relation was shifted leftward in failing compared with control cardiomyocytes. After PKA treatment the force–pCa curves were similar for all groups. Values are expressed as means ±s.e.m. from n= 10 cardiomyocytes in each group.

