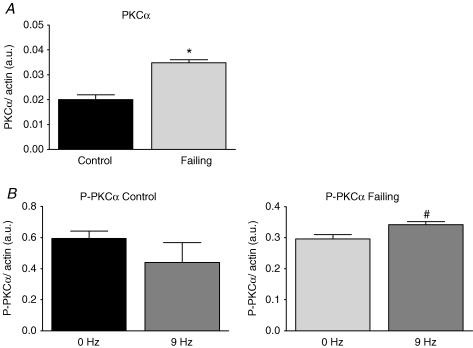
Figure 9. Expression and phosphorylation levels of PKCα in quiescent (0 Hz) and stimulated (9 Hz) control and failing hearts.
A, increased expression of PKCα in failing hearts compared with control. B, frequency dependency of PKC phosphorylation in failing hearts but not in control. Abbreviations used: PKCα, protein kinase C α; P-PKCα, phosphorylated PKCα. Values are expressed as means ±s.e.m.*P < 0.05 versus control, #P < 0.05 versus 0 Hz.

