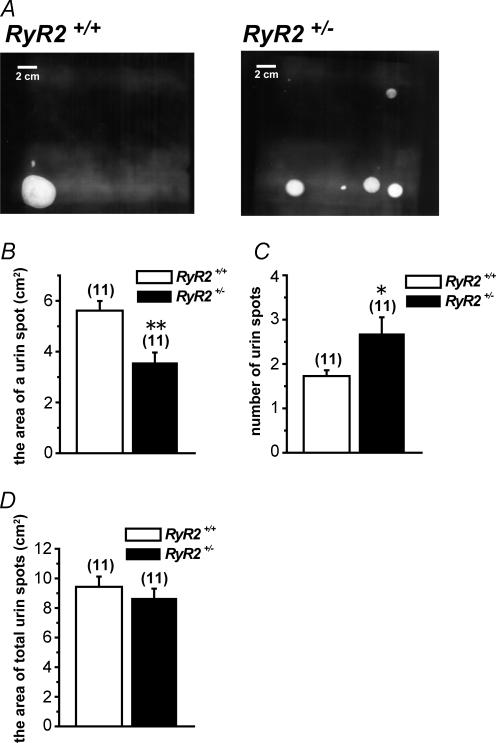
Figure 8. Urinary bladder activity of RyR2+/+ and RyR2+/–
A, representative urination pattern of freely moving female mice visualized on filter papers under UV light from RyR2+/+ and RyR2+/−. B, average area of a urine spot quantified from filter paper. C, average number of urine spots quantified from filter paper. D, average area of total urine spots quantified from filter paper. B–D, numerals in parentheses indicate the number of animals. *P < 0.05, **P < 0.01 versus RyR2+/+.

