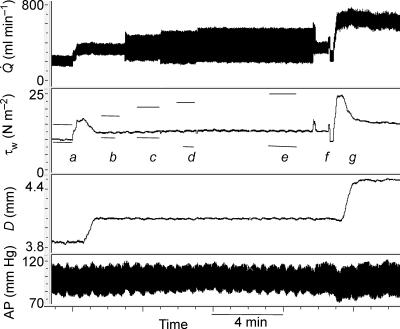
Figure 7. Records obtained in one pig showing the effects of independent changes in the mean and amplitude of flow ( ) on the mean (τw) and calculated amplitude (horizontal bars) of wall shear stress and arterial diameter (D).
At a mean flow was increased from 183 to 318 ml min−1 with no change in amplitude (100 ml min−1), mean shear stress increased from 9.9 to 16.8 N m−2 followed by dilatation of the artery from 3.85 to 4.1 mm. Equilibrium between mean wall shear stress (12.5 N m−2) and diameter (4.10 mm) was achieved at b; from a to b the amplitude of wall shear stress was constant (7.4 N m−2). The amplitude of wall shear stress was then increased, with no change in mean, to 13.7 N m−2 (c), 17.2 N m−2 (d) and 18.3 N m−2 (e). These increases in the amplitude of wall shear stress at constant mean had no detectable effects on arterial diameter. At f the amplitude of flow was reduced to control level (a) with no effect on arterial diameter. At g mean wall shear stress was increased to 24.6 N m−2 causing a further increase in diameter from 4.1 to 4.5 mm.

