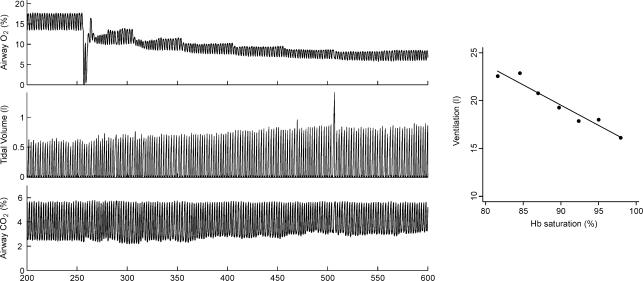
Figure 2. Example of hypoxic ventilatory response during hypoglycaemia.
The left panel shows the instantaneous measurement of airway gases and tidal volume. The end-tidal  and
and  are controlled by manipulation of the inspired gas concentration. The right panel shows the ventilation versus saturation for each of the seven defined time intervals (see text) and the linear regression line.

