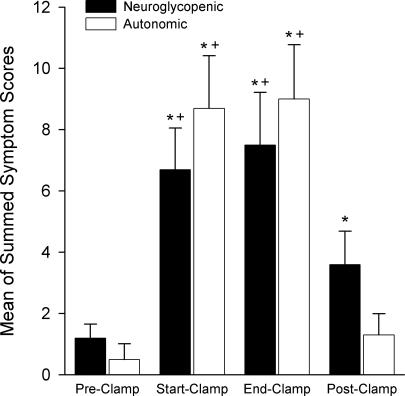
Figure 6. Neuroglycopenic and autonomic symptoms scores Average of the symptom score.
shown as the symptoms related to an increase in autonomic activity and those related to neuroglycopenia (Mitrakou et al. 1991) for the hypoglycaemic clamp. Statistical testing (see Methods): *significantly different from Pre-Clamp value; +significantly different from Post-Clamp value.

