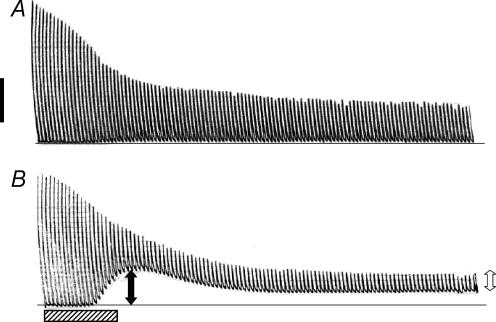
Figure 1. Representative traces showing the changes in unstimulated force, peak tetanic force and peak total force during fatigue in (A) one control wild-type and (B) one glibenclamide wild-type FDB bundle.
Fatigue was elicited at 37°C with one tetanic contraction every second for 3 min. Peak tetanic force (open arrow in B) was calculated as the difference between the force just before contraction and the maximum force during contraction. Unstimulated force (filled arrow in B) was calculated from the difference in force between the baseline just before fatigue (horizontal line in A and B) and the force before contraction. Peak total force was calculated as the sum of the unstimulated force and peak tetanic force. Horizontal hatched bar represents 30 s; vertical black bar represent 15 N cm−2.

