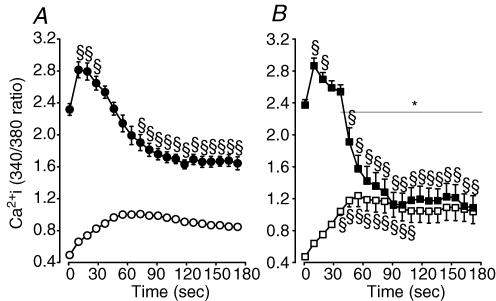
Figure 11. The increase in unstimulated and the decrease in peak were smaller and slower in control conditions than in the presence of glibenclamide.
Mean changes in unstimulated and peak during fatigue at 37°C in control (A) and glibenclamide (10 μm) wild-type FDB single fibres (B). Symbols:^, •, control wild-type unstimulated and peak , respectively; □, ▪, glibenclamide (10 μm) wild-type unstimulated and peak , respectively. Vertical bars represent the s.e.m. of 13 control and 19 glibenclamide fibres from 9 wild-type mice. *Time (with horizontal line) when peak of glibenclamide fibres was significantly different from control fibres, ANOVA and lsd,P < 0.05. §Mean unstimulated or peak significantly different from mean value at time 0, ANOVA and lsd,P < 0.05.

