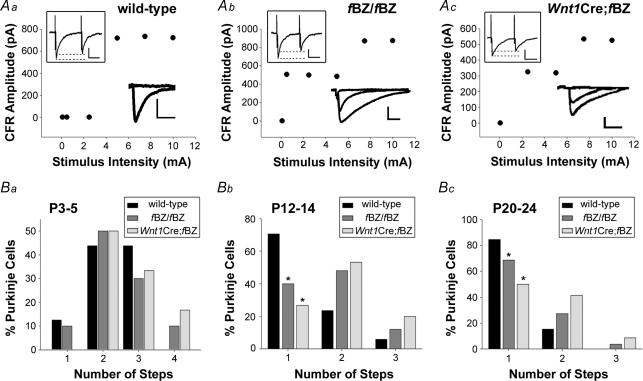
Figure 3. Purkinje cells remain innervated by multiple climbing fibres in TrkB mutant mice.
A, plots of climbing fibre response (CFR) amplitude versus stimulus intensity from Purkinje cells of P20–24 wild-type (a), fBZ/fBZ (b), and Wnt1Cre;fBZ/fBZ (c) cerebella. The lower right insets are representative of the CFRs used to generate the plots. Scale bars: vertical, 200 pA; horizontal, 10 ms. The upper left insets depict paired pulse depression upon climbing fibre activation. Scale bars: vertical, 250 pA; horizontal, 10 ms. B, the percentage of Purkinje cells recorded with 1, 2, 3 or 4 CFRs (steps) at P3–5 (a), P12–14 (b), and P20–24 (c). (P3–5: n= 15 wild-type cells, n= 11 fBZ/fBZ cells, and n= 6 Wnt1Cre;fBZ/fBZ cells; P12–14: n= 19 wild-type cells, n= 26 fBZ/fBZ cells, and n= 15 Wnt1Cre;fBZ/fBZ cells; P20–24: n= 71 wild-type cells, n= 68 fBZ/fBZ cells, and n= 52 Wnt1Cre;fBZ/fBZ cells). At P12–14 (Bb) and P20–24 (Bc), a larger percentage of Purkinje cells retain multiple innervation in the TrkB mutant (fBZ/fBZ and Wnt1Cre;fBZ/fBZ) mice as compared with the wild-type mice (P12–14: χ2= 15.9, *P < 0.001; P20–24: χ2= 18.9, *P < 0.001 by χ2 test).

