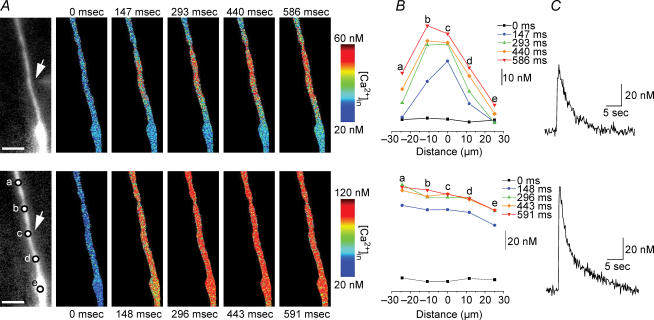
Figure 4. Comparison of dendritic [Ca2+]i signals induced byα7 nAChR activation and during depolarization.
A, series of pseudo-colour images of [Ca2+]i signals in the same dendrite due to iontophoretic application of choline (top row), and due to depolarization (bottom row; from −70 mV to +10 mV for 100 ms). The arrow on the left fluorescence images depicts the location of the iontophoretic electrode; the scale bars are 10 μm. B, the time-dependent changes in [Ca2+]i levels from five different locations for the dendrite in A (bottom left image). C, the [Ca2+]i signals induced by choline (top) and depolarization (bottom) for the region nearest to the iontophoretic electrode (i.e. ‘c’).

