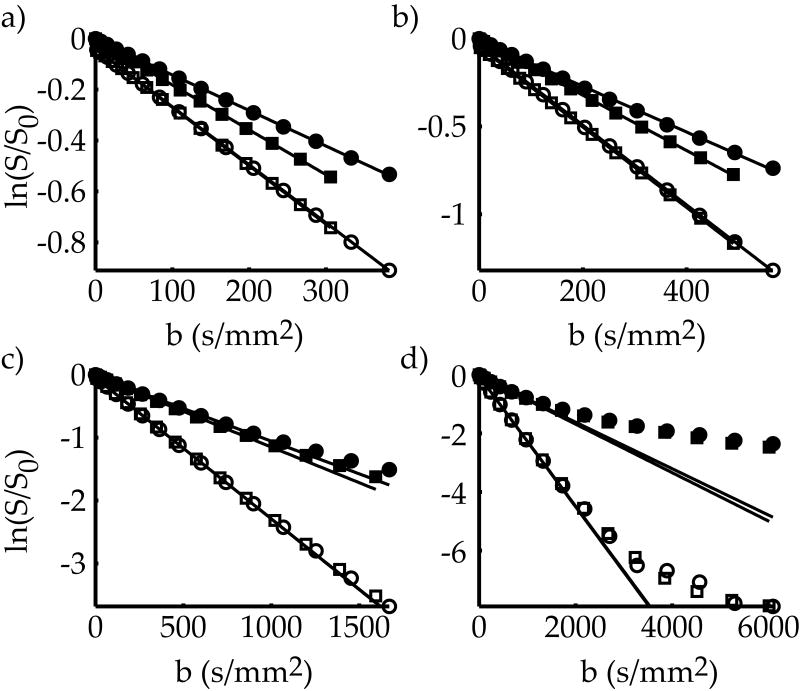
Fig 2.
Representative plots of diffusion attenuation from the reference phantom (open squares and circles) and glass beads phantom with the mean size of 90 μm (filled squares and circles) at evolution times of 8, 16, 64 and 256 ms (a–d). The bPGSTE and MAGSTE measurements were shown in circles and squares, respectively, with the least square fitting of low b values (<1,000 s/mm2) shown in solid lines.

