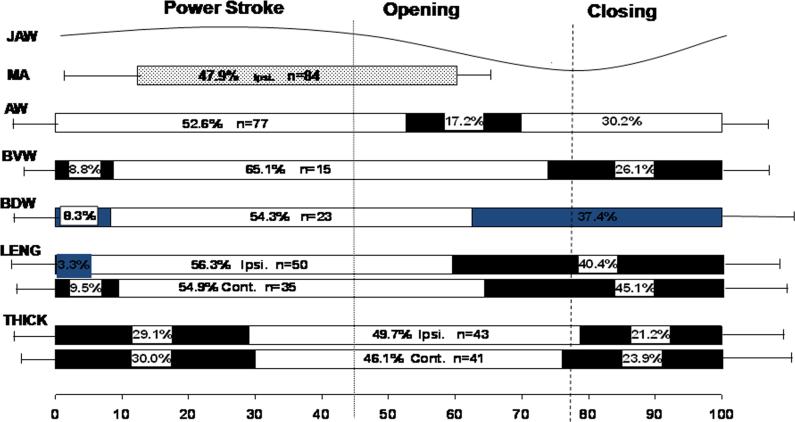
Fig. 2.
– Timing comparisons for tongue dimensional changes in relation to jaw movement and ipsilateral masseter activity. Values are represented as a percentage of the same chewing cycle length defined by the horizontal scale line at the bottom (100%). Dotted and dashed vertical lines indicate start of jaw opening and maximal opening, respectively. Bar lengths indicate the mean duration of increasing (solid bars) and decreasing (empty bars) of dimensional changes. The horizontal lines to the left and right of bars indicate 1 S.D. of onset and duration, respectively; n: numbers of chewing cycles analyzed. Ipsi.: ipsilateral side; Cont.: contralateral side. Jaw: jaw movement; MA: masseter; AW: anterior width; BVW: base ventral width; BDW: base dorsal width, LENG: bilateral body lengths; THICK: bilateral base thicknesses.

