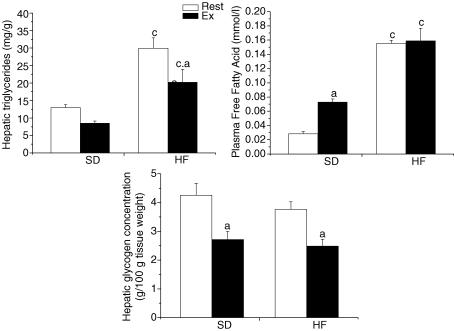
Figure 2. Hepatic triglyceride and glycogen concentrations and plasma free fatty acid levels in resting (Rest) and exercised (Ex) rats after two weeks of a standard (SD) or a high-fat (HF) diet.
Values are means ± s.e.m. with n = 8–10 rats/group. aSignificantly different between Rest and Ex groups, P < 0.05. cSignificantly different from the SD-fed counterpart, P < 0.05

