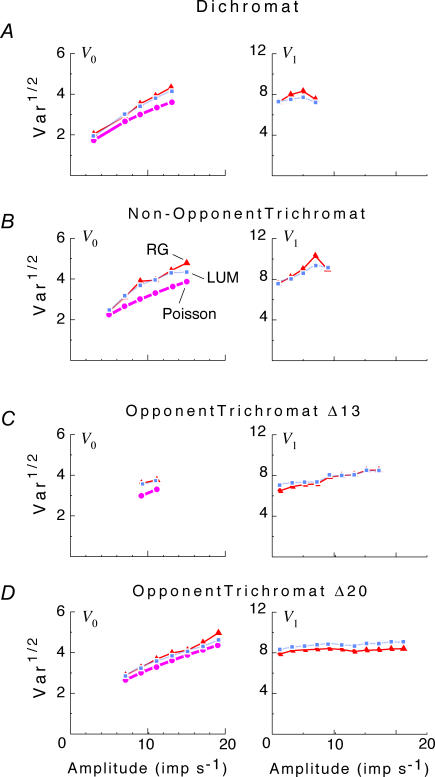
Figure 5. Comparison of response variance Vk at as a function of response size ∣zk∣ for RG and LUM conditions for the DC response (f0), left column, and the fundamental Fourier component (f1), right column.
Top row, all dichromat neurons. Second row, non-opponent neurons from all trichromats. Third row, opponent neurons from Δ13 trichromats. Fourth row, opponent neurons from Δ20 trichromats. Variances plotted are V0 and V1, as defined by eqn (3) and interpolated by eqn (5). For f1 responses in Δ20 trichromats, there is a larger variance under LUM than RG conditions at all response sizes. For f0, the Poisson prediction V0 =z0 is also shown. All variances are somewhat greater than the Poisson prediction.

