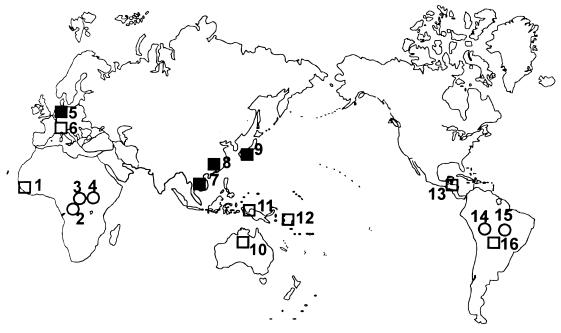
Figure 1.
Distribution of the samples considered. Samples and sample sizes for the three types of markers (microsatellites, RFLPs, RFLP–individual genotypes) are as follows: 1, Senegalese (0, 0, 28); 2, Mbuti pygmies from Zaire (10, 81, 28); 3, Lisongo from Central African Republic (9, 0, 0); 4, Biaka pygmies from Central African Republic (10, 67, 27); 5, North Europeans (15, 348, 28); 6, Northern Italians (14, 110, 0); 7, Cambodians born in Cambodia sampled in the San Francisco area (10, 124, 27); 8, Chinese born in China sampled in the San Francisco area (10, 110, 28); 9, Japanese born in Japan sampled in the San Francisco area (10, 74, 28); 10, Australians from the Northern Territory (10, 35, 15); 11, New Guineans (10, 127, 27); 12, Nasioi melanesians from Bougainville, Solomon Islands (10, 33, 21); 13, Maya from Yucatan peninsula, Mexico (10, 0, 14); 14, Karitiana from Rondonia, Brazil (10, 0, 0); 15, Suruì from Rondonia, Brazil (10, 0, 0); and 16, mixed Suruì and Karitiana (0, 50, 0). Different symbols refer to the expected levels of population complexity. Open circles, single villages or camps; open squares, groups of villages or localities; and solid squares, entire countries or subcontinental regions.

