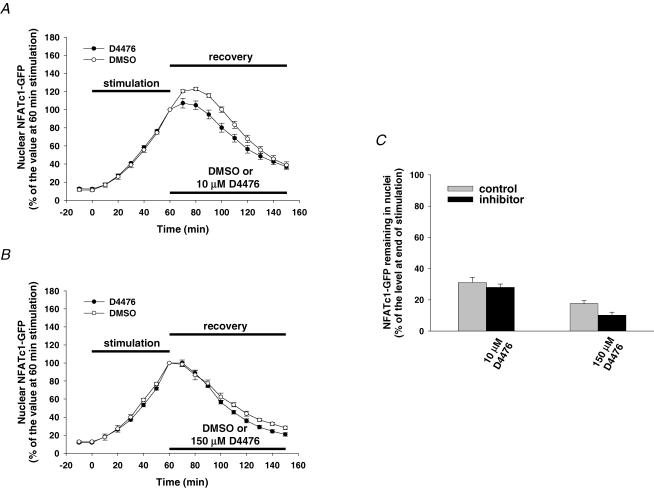
Figure 5. Effect of CK1δ inhibition on NFATc1–GFP nuclear export.
A and B, time courses of NFATc1–GFP nuclear translocation resulting from electrical stimulation and nuclear export in presence of the solvent DMSO or different doses of the CK1δ-selective inhibitor D4476 (A, 10 μm, six nuclei from six fibres; B, 150 μm, eight nuclei from six fibres). C, percentage of the NFATc1–GFP nuclear fluorescence still remaining in the nucleus 90 min after cessation of stimulation (normalized to the 60 min stimulation value) in the absence (control) or presence of CK1δ inhibitor.

