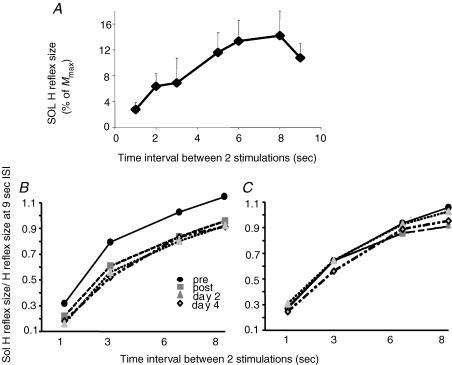
Figure 2.
Changes in homosynaptic depression of the soleus H reflex A, homosynaptic depression in one representative subject. Homosynaptic depression was assessed by the frequency-related depression of the Sol H reflex, as the decrease of size of the H reflex when decreasing the time interval between two consecutive stimulations (here from 9 to 1 s). In this subject, the curve reached a plateau at 8 s ISI. Each point represents the mean of 20 reflexes. B and C, modulation of homosynaptic depression of the Sol H reflex by the training in the two groups: subjects performing the complex cycling task (B); and subjects performing the simple cycling task (C). For each time (pre- and post-training, 24 and 96 h after training), sizes of the Sol H reflexes were normalized to the size of the reflex at the 9 s ISI. To compare the amount of HD at the different times, the intensity of the stimulation was adjusted in order that the size of the reflex at the 9 s ISI was the same during the three post-training measurements as during the pretraining one. B, after complex training, HD was increased and maintained the same level at days 2 and 4. Each point represents the mean of 260 reflexes. C, after simple training, HD was not modified. Each point represents the mean of 180 reflexes.

