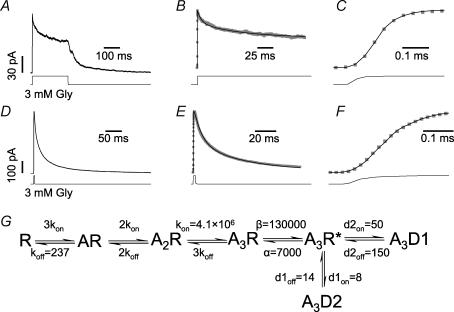
Figure 1. Kinetic scheme for the activation of heteromeric glycine receptors by saturating concentrations of glycine.
A, shows the averaged current response of an outside-out patch to a 200 ms application of 3 mm glycine. The time course of glycine concentration (taken from the open tip potential recorded at the end of the experiment) is shown at the bottom of the trace in this and the following figures. B, continuous black line shows the fit to the data ( ) obtained after optimizing the rate constants in the model shown in G. C, shows the response onset on an expanded timescale; note the good agreement of the fitted curve (black line) to the experimental inward current. D, shows the averaged current response to a short (3 ms) application of 3 mm glycine. The deactivation phase was empirically fitted with two exponentials (see Results). The data were fitted to the model in G with association and dissociation rate constants (kon and koff, respectively) as free parameters and the desensitization and resensitization rates fixed to the average values obtained from the fits of 200 ms steps. F, shows the rising phase of the trace and the fit of E on an expanded timescale (note the different sampling rate of 20 μs, instead of 40 μs as in C). G, the scheme was used to fit the data and shows the average of the rate constants fitted to the data from five patches (for the 200 ms steps) and six patches (for the 3 ms steps; units are s−1 or s−1 μm−1 as appropriate).

