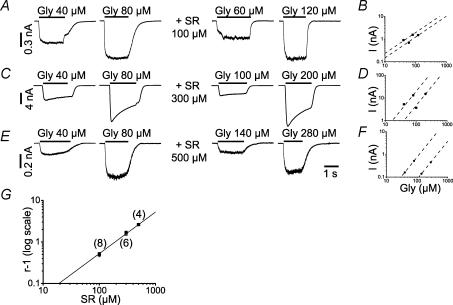
Figure 2. Schild analysis of the effect of co-application of SR-95531 (100, 300 and 500 μm) on whole-cell responses to glycine.
A, C and E, show inward currents in response to approximately equipotent glycine concentrations with and without three different concentrations of antagonist. B, D and F, show the shifts in the glycine dose–response curves produced by these three antagonist concentrations and are the fits of two power functions (with the constraint of equal slopes) to the peak currents measured in each experiment. For each antagonist concentration the dose ratio (r) was calculated as the distance between the two parallel lines. G, the Schild plot uses the average dose ratio values from all recordings (plotted on a log–log scale versus the antagonist concentrations). The fit to the Schild equation (slope constrained to one) gave a value of equilibrium dissociation constant (KB) of 191 ± 8 μm (the number of cells at each concentration is indicated above each point).

