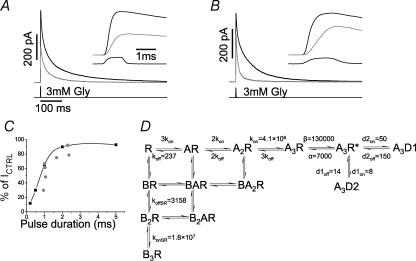
Figure 4. Inhibition of responses to short glycine pulses by equilibrium application of SR-95531.
A and B, show two examples of responses to 3 mm glycine before (black trace) and during (grey trace) steady-state application of 288 μm antagonist. There is a consistent increase in the rise time of the response (see insets), but the percentage inhibition of the peak is different in the two cases. This is correlated with the actual length of the glycine concentration pulse, which is shorter in A (∼1 ms) than in B (∼1.6 ms). C, this is shown for seven experiments in which the actual length of the pulse was plotted against the percentage reduction of peak current in the presence of SR-95531 ( ). The prediction of the response to square pulses of glycine of variable duration are shown in the same graph (▪; joined by cubic splines for clarity). D, gives a summary of the values of the rate constants fitted from the different experimental protocols.

