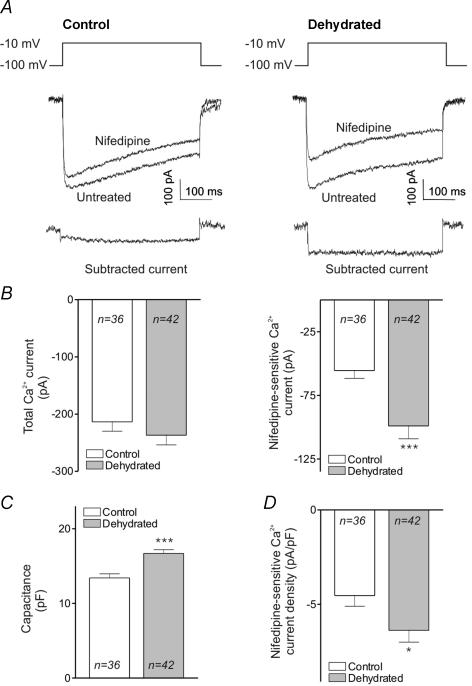
Figure 1. Nifedipine-sensitive Ca2+ currents in MNCs isolated from control and dehydrated rats.
A. whole-cell recordings showing representative Ca2+ currents evoked by stepping from −100 to −10 mV in the absence and presence of nifedipine. ‘Control’ refers to currents evoked in MNCs isolated from normally hydrated rats while ‘dehydrated’ refers to currents evoked in MNCs isolated from rats deprived of water for 24 h. The subtracted currents show the nifedipine-sensitive currents for the two conditions. B, left, a bar graph showing the mean amplitudes of total Ca2+ current evoked under these conditions. These values are not statistically different. B, right, a bar graph showing the amplitude of nifedipine-sensitive Ca2+ current evoked under these conditions. There is a highly significant difference between the current amplitude in control and dehydrated rats (P < 0.001). C, a bar graph comparing the whole-cell capacitance of MNCs isolated from control and dehydrated rats (P < 0.001). D, a bar graph of the density of nifedipine-sensitive Ca2+ currents in control and dehydrated rats (P < 0.05).

