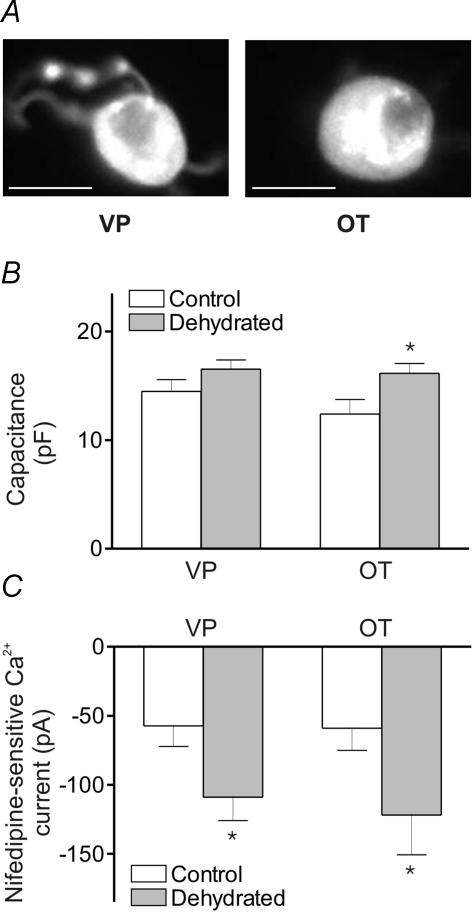
Figure 3. Capacitance measurements and nifedipine-sensitive Ca2+ currents in identified VP and OT MNCs.
A, immunofluorescence images of MNCs after whole-cell recording showing immunoreactivity to anti-NP II (left) and anti-NP I (right). The scale bar is 15 μm. B, a bar graph showing the whole-cell capacitance of MNCs isolated from control and dehydrated rats that were immunoreactive for VP (n = 8 and 14, respectively) and OT (n = 5 and 4, respectively; P < 0.05). C, a bar graph showing the nifedipine-sensitive Ca2+ current amplitude in MNCs isolated from control and dehydrated rats that were immunoreactive for VP (n = 8 and 14, respectively; P < 0.05) and OT (n = 5 and 4, respectively; P < 0.05).

