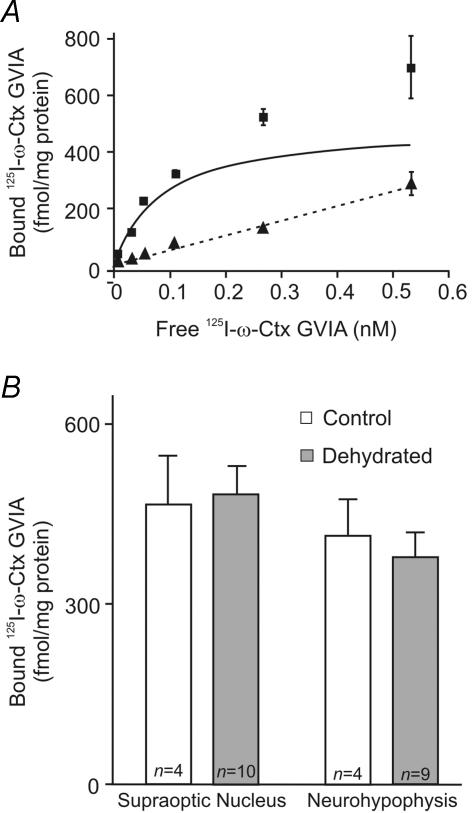
Figure 4. Saturation binding of 125I-ω-CTX GVIA in tissue homogenates of the SON and neurohypophysis from control and dehydrated rats.
A, a saturation binding curve for 125I-ω-CTX GVIA in a homogenate of SON tissue. ▪, the amount of bound 125I-ω-CTX GVIA at the indicated concentrations of free 125I-ω-CTX GVIA. ▴ and dashed line show the amount of non-specific binding at the same concentrations, which were obtained by performing the binding reaction in the presence of 0.1 μm of the non-iodinated ω-CTX GVIA. The continuous line shows the calculated binding isotherm for 125I-ω-CTX GVIA. B, the bar graphs show the calculated BMAX for 125I-ω-CTX GVIA in the SON and neurohypophysis from control and dehydrated rats. These values are not significantly different for either the SON or neurohypophysis. The n values shown represent the number of experiments performed, each of which used pooled tissue from 4 rats.

