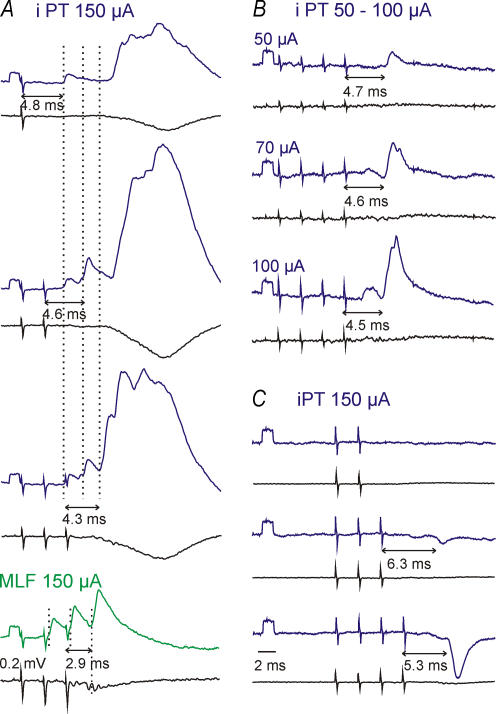
Figure 2. Excitatory and inhibitory postsynaptic potentials evoked by stimulation of the ipsilateral PT.
Averaged (n = 10–20) intracellular records (top traces) and records from the cord dorsum (bottom traces). A, B and C, records from 3 different motoneurones. A, comparison of EPSPs evoked by an increasing number of PT stimuli and of monosynaptic EPSPs from the MLF in a sartorius motoneurone. Three dotted lines and double headed horizontal arrows indicate early EPSPS evoked by the successive stimuli. B, comparison of EPSPs evoked by stimuli of increasing intensity in a posterior biceps–semitendinosus motoneurone. C, comparison of IPSPs evoked by increasing numbers of PT stimuli in a gastrocnemius–soleus motoneurone. The numbers below the arrows indicate latencies of the EPSPs or IPSPs from the stimuli that evoke them. Rectangular pulses at the beginning of the intracellular records are calibration pulses (0.2 mV). Time calibration in C is for all panels. In this and the following figures the negativity is down in intracellular records and up in records from the cord dorsum.

