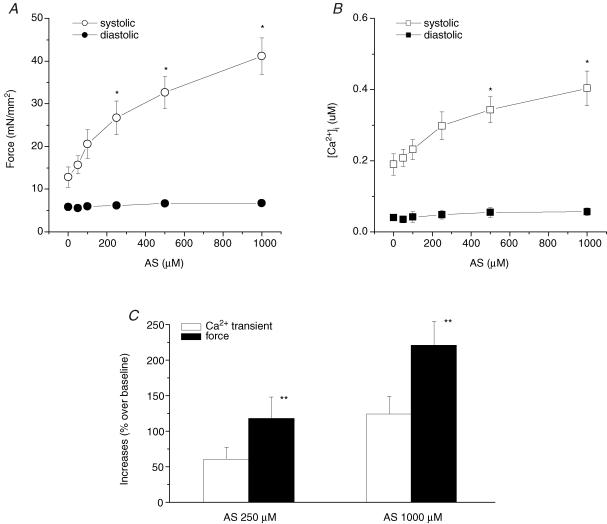
Figure 2. Pooled data of force development and [Ca2+]i transients at varied concentrations of AS.
Both force (A) and [Ca2+]i transients (B) increased in a dose dependent manner after exposing to AS. The increases in developed force were more than the increases in [Ca2+]i transients (C). AS did not affect neither diastolic force nor diastolic [Ca2+]i levels. Temperature, 22°C; sarcomere length, 2.2–2.3 μm; [Ca2+]o = 1.0 mm; n = 8–9 in each group. *P < 0.01 versus baseline; **P < 0.05 versus increases in [Ca2+]i transients.

