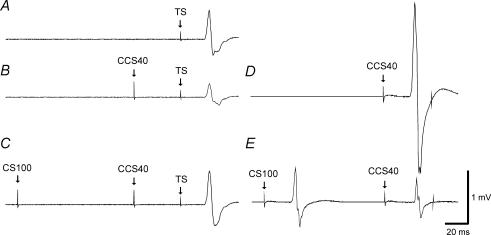
Figure 5. Effects of LICI on IHI40 in a representative subject.
Waveforms are the average of 10 trials. Traces A, B and C are from the right FDI muscle and traces D and E are concurrent recordings from the left FDI muscle. A, response to 1 mV TS alone (condition 3A). B, IHI401mVCS100 alone: the CCS401mVCS100 pulse reduced the amplitude of the TS MEP (condition 3J). C, IHI401mVCS100 in the presence of LICI: the CS100 pulse preceding the CCS401mVCS100 pulse led to inhibition of IHI resulting in an increase in MEP amplitude (condition 3K). The presence of LICI in the left FDI muscle was demonstrated by reduction in the MEP amplitude from D (condition 3J) to E (condition 3K), due to the CS100 pulse.

