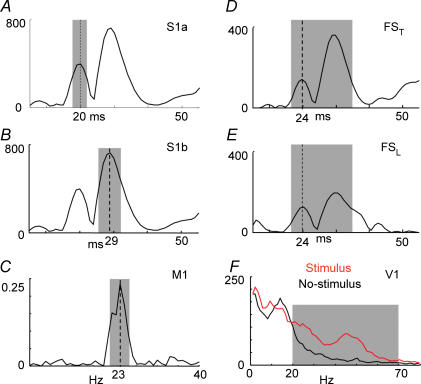
Figure 2. FSS functional constraints.
Representation of the quantities maximized by the functional constraint to obtain the FS in our different applications. A, FS responsiveness following the contralateral median nerve stimulation. The grey area indicates the time interval around 20 ms where the responsiveness is maximized (corresponding separated source S1a); B, as in A, with the grey area indicating the time interval around 30 ms where the responsiveness is maximized (obtaining S1b); C, cortico-muscular coherence. The grey area indicates the frequency interval around 20 Hz where the cortico-muscular coherence is maximized (obtaining M1); D, FS responsiveness following the thumb stimulation. The grey area indicates the time window from 20 to 40 ms where the responsiveness is maximized (FST); E, evoked activity following the little finger stimulation. The grey area indicates the time window from 20 to 40 ms where the responsiveness is maximized (FSL); F, PSD of the FS in the Stimulus\No-stimulus condition. The grey area indicates the frequency interval from 20 to 70 Hz where the spectral difference between Stimulus and No-stimulus conditions is maximized (obtaining V1). Note that the y axes do not have measurable units, as FSs do not have a physical unit dimension, before retro-projection on the original signal space.

