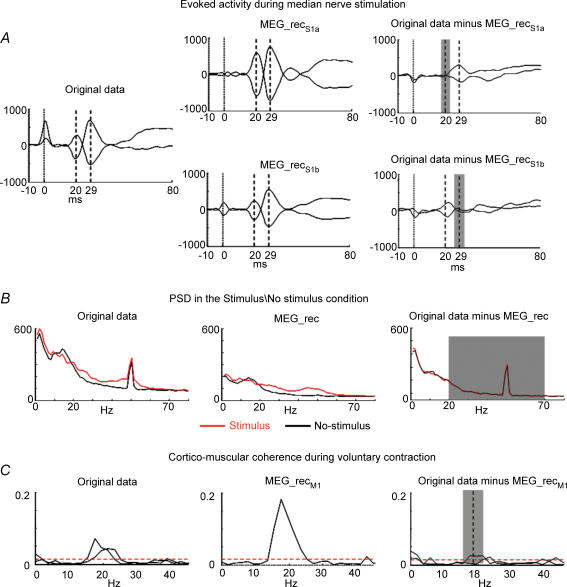
Fig. 3. FS discrepancy.
A, evoked activity during median nerve stimulation. In one representative subject, the two most representative parietal channels are superimposed in the time window [−10, 80] ms, after averaging on median nerve stimuli, t = 0 being the stimulus arrival at wrist (vertical continous line). The time points corresponding to M20 and M30 components are indicated (vertical dashed lines). Left: original data. Centre: retro-projected data with only the S1a source (top, MEG_recS1a) and with only the S1b source (bottom, MEG_recS1b). Right: original data minus MEG_recS1a (top) and original data minus MEG_recS1b (bottom). The grey area indicates the time interval ( top,
top,  , bottom) where the functional constraint, i.e. the FS responsiveness, is maximized. Note that both S1a and S1b well explain the generated field at their respective latencies. B, PSD in the Stimulus\No-stimulus condition. Left: PSD of one representative MEG sensor signal in the occipital region displayed in the frequency window [0, 80] Hz. Centre: retro-projected channel with the estimated FS (MEG_rec). Right: PSD of the original MEG data minus MEG_rec channel. The grey area indicates the frequency interval [20, 70] Hz) where the functional constraint, i.e. the band power difference between Stimulus and No-stimulus conditions, is maximized. C, cortico-muscular coherence during voluntary contraction. The two channels most coherent with electromyographic activity are chosen. Their coherences with the rectified EMG in the frequency window [0, 45] Hz. The confidence limit is indicated (0.015, horizontal dashed line). Left: original data. Centre: retro-projected channels with only M1 (MEG_recM1). The two channels display the same coherence with the EMG signal, as all the channels obtained by retro-projecting only one FS display the same time evolution, unless a multiplicative factor and the coherence is independent from the signals amplitude. Right: original MEG data minus MEG_recM1 channels. The grey area indicates the frequency interval (
 ) where the FS–muscular coherence (dimensionless) is calculated.

